Visualization#
One key thing many people are interested in is how to visualize their data. Below are some examples/ explanations of how to visualize your data.

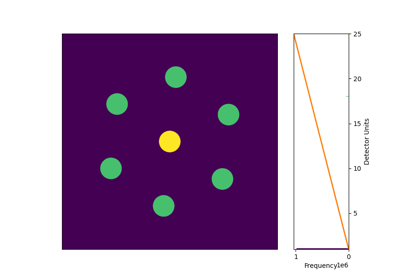
Creating a Simple Dashboard with Panel and Matplotlib
Creating a Simple Dashboard with Panel and Matplotlib