Note
Go to the end to download the full example code.
Creating a Custom Virtual Mask#
Virtual images are easily created from a series of (currently) 4 seperate masks. These masks are 8 bit images with values:
0: Negative Mask, pixel values subtracted 1: Default value, pixels not accounted for 2: Positive Mask, pixel values added
Additionally virtual images can be
from deapi import Client
import matplotlib.pyplot as plt
import time
from skimage.draw import disk
import sys
c = Client()
if not sys.platform.startswith("win"):
c.usingMmf = False # True if on same machine as DE Server and a Windows machine
c.connect(port=13240) # connect to the running DE Server
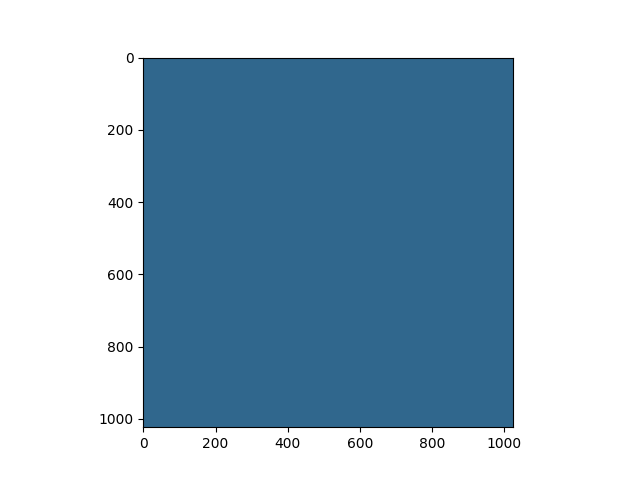
c.virtual_masks[0][:] = 1 # Set everything to 1
c.virtual_masks[0].plot() # plot the current v0 mask
print("Virtual Mask 0: ", c.virtual_masks[1][:].shape)

Virtual Mask 0: (1024, 1024)
Changing the virtual mask#
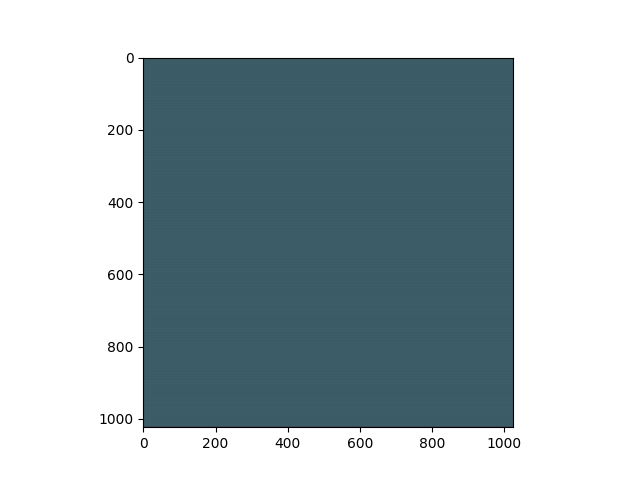
Each of the virtual masks will act like a numpy array such that you can use numpy fancy indexing to slice or assign the array. For example we can set a portion of the mask to be 2 (positive mask)
<Axes: >
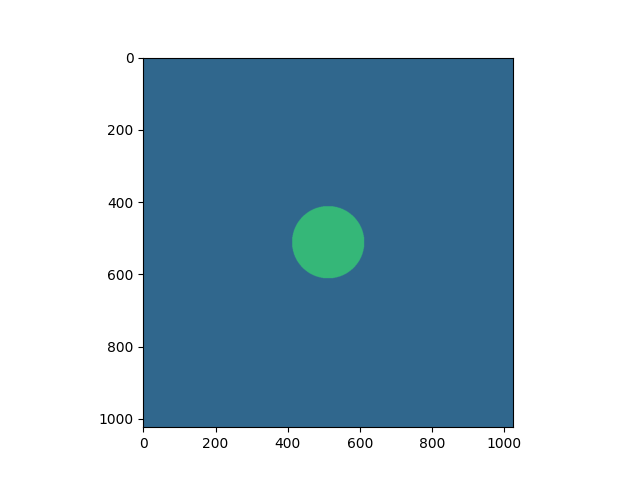
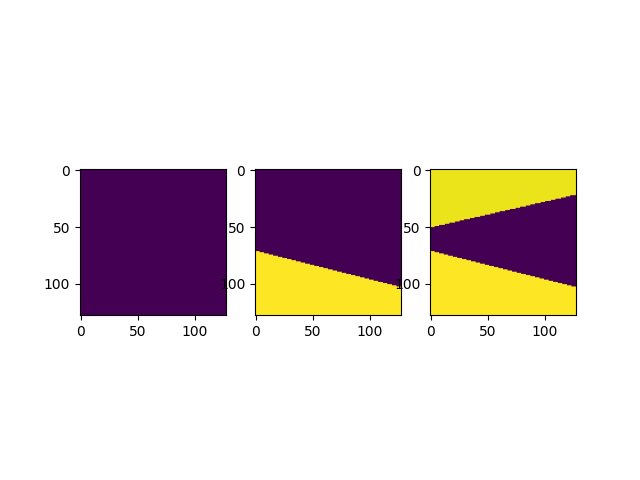
Subtracting and adding#
Different modes can be used with each virtual image. These are set using The calculation attribute. Lets try that with Virtual image 1
/home/runner/work/deapi/deapi/deapi/data_types.py:840: UserWarning: Virtual mask shape is not set to Arbitrary. Setting to Arbitrary.
  warnings.warn(

<Axes: >
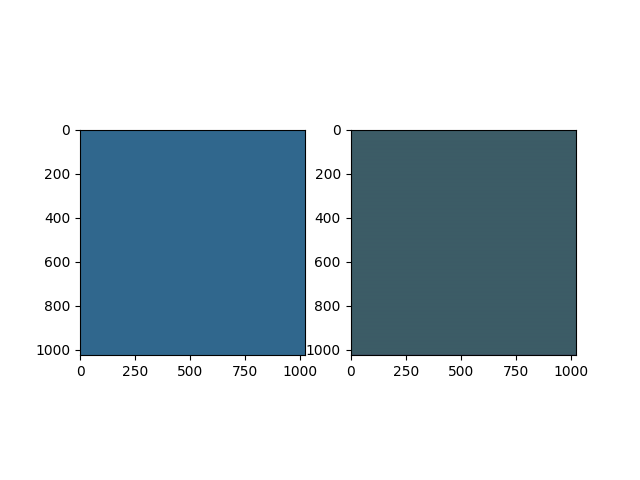
Creating a Virtual BrightField Image#
<Axes: >
Starting an Acquisition#
Once we have set up an experiment we can start an acquisition using the start acquisition function
c["Frames Per Second"] = 5000  # 5000 frames per second
c.scan(enable="On", size_x=16, size_y=16)
c.start_acquisition()

while c.acquiring:  # wait for acquisition to finish and then plot the results
    time.sleep(1)

fig, axs = plt.subplots(1, 3)
for a, virt in zip(axs, ["virtual_image0", "virtual_image1", "virtual_image2"]):
    data, _, _, _ = c.get_result(virt)
    a.imshow(data)

c.disconnect()
Total running time of the script: (0 minutes 1.959 seconds)